August sixth, twenty twenty six by Liz Everett Krisberg, Head of Bank of America Institute and David Michael Tinsley, Senior Economist, Bank of America Institute
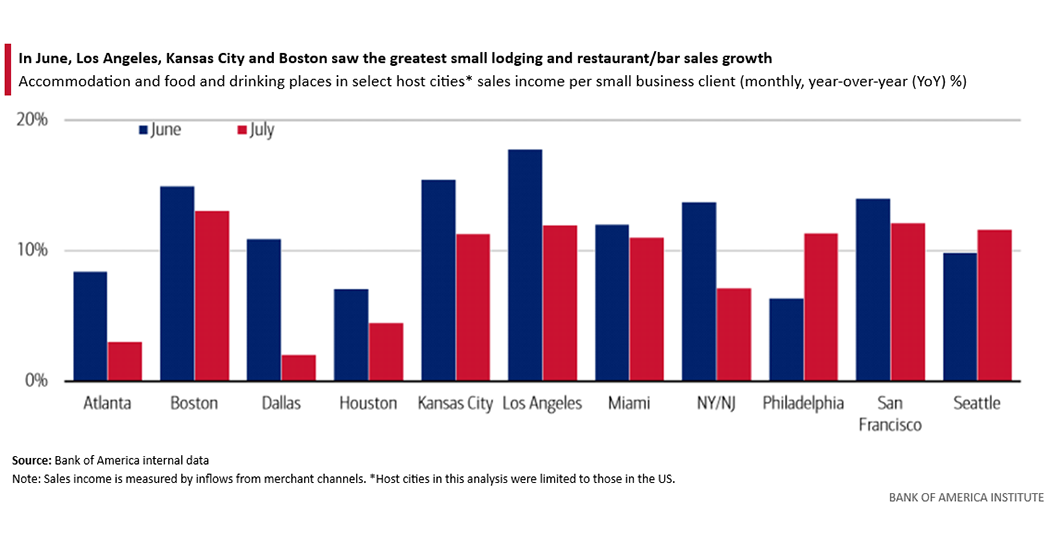
This is a grouped bar chart illustrating accommodation and food and drinking places in select host cities sales income per small business client for June and July. Los Angeles had the strongest growth in June at around seventeen percent Y o Y, followed by Kansas City at around fifteen point five percent Y o Y, and Boston at around fifteen percent. Philadelphia had the lowest growth in June at around six percent Y o Y. In July, Boston had the highest growth at around thirteen point five percent Y o Y, followed by Kansas City, San Francisco, and Seattle. Dallas had the lowest growth at around three percent.
Source: Bank of America internal data
Note: Sales income is measured by inflows from merchant channels. *Host cities in this analysis were limited to those in the U S.
BANK OF AMERICA INSTITUTE
Over F I F A World Cup twenty twenty six™, consumer spending in host cities rose around five percent Y o Y, with the strongest gains coming from non-locals, whose spending was up more than seventeen percent Y o Y. Restaurants, bars and hospitality businesses were among the biggest winners as fans spent on dining, entertainment and accommodations.
In June, small restaurants, bars, boutique hotels and other lodging providers saw some of the strongest sales growth in Los Angeles, Kansas City and Boston. While the impact on the broader U S economy was more modest, the event provided a clear example of how major sporting events can generate meaningful economic activity in the communities that host them.
Read more on the economic impact of the tournament in our publication: On the ball: World Cup 2026 final score.
Selected Bank of America transaction data is used to inform the macroeconomic views expressed in this report and should be considered in the context of other economic indicators and publicly available information. In certain instances, the data may provide directional and/or predictive value. The data used is not comprehensive; it is based on aggregated and anonymized selections of Bank of America data and may reflect a degree of selection bias and limitations on the data available.
Any payments data represents aggregated spend from U S Retail, Preferred, Small Business and Wealth Management clients with a deposit account or credit card. Aggregated spend include total credit card, debit card, A C H, wires, bill pay, business/peer-to-peer, cash, and checks.
Any Small Business payments data represents aggregate spend from Small Business clients with a deposit account or a Small Business credit card. Payroll payments data include channels such as A C H (automated clearing house), bill pay, checks and wire. Bank of America per Small Business client data represents activity spending from active Small Business clients with a deposit account or a Small Business credit card and at least one transaction in each month. Small businesses in this report include business clients within Bank of America and generally defined as under five million dollars in annual sales revenue.
Unless otherwise stated, data is not adjusted for seasonality, processing days or portfolio changes, and may be subject to periodic revisions. The differences between the total and per household card spending growth rate (if discussed) can be explained by the following reasons:
Any household consumer deposit data based on Bank of America internal data is derived by anonymizing and aggregating data from Bank of America consumer deposit accounts in the U S and analyzing that data at a highly aggregated level. Whenever median household savings and checking balances are quoted, the data is based on a fixed cohort of households that had a consumer deposit account (checking and/or savings account) for all months from January twenty nineteen through the most current month of data shown.
Bank of America aggregated credit/debit card spending per household includes spending from active U S households only. Only consumer card holders making a minimum of five transactions a month are included in the dataset. Spending from corporate cards are excluded. Data regarding merchants who receive payments are identified and classified by the Merchant Categorization Code (M C C) defined by financial services companies. The data are mapped using proprietary methods from the M C Cs to the North American Industry Classification System (N A I C S), which is also used by the Census Bureau, in order to classify spending data by subsector. Spending data may also be classified by other proprietary methods not using M C Cs.
Transactions and spending associated with the F I F A World Cup twenty twenty six™ are based on data aggregated point-of-sale credit and debit card spending in C B S As (core based statistical areas) associated with tournament stadiums.
Lower, middle and higher household income cuts in Bank of America credit and debit card spending per household, and consumer deposit account data are based on quantitative estimates of each households' income. These quantitative estimates are bucketed according to terciles, with a third of households placed in each tercile periodically. The lowest tercile represents 'lower income', the middle tercile represents 'middle income' and the highest tercile 'higher income'. The income thresholds between these terciles will move over time, reflecting any number of factors that impact income, including general wage inflation, changes in social security payments and individual households' income. The income and tercile in which a household is categorised are periodically re-assessed.
Generations, if discussed, are defined as follows: Gen Z, born after nineteen ninety five; Younger Millennials: born between nineteen eighty nine through nineteen ninety five; Older Millennials: born between nineteen seventy eight through nineteen eighty eight; Gen Xers: born between nineteen sixty five through nineteen seventy seven; Baby Boomer: nineteen forty six through nineteen sixty four; Traditionalists: pre-nineteen forty six.
Any reference to card spending per household on gasoline includes all purchases at gasoline stations and might include purchases of non-gas items.
Transactions and spending associated with the F I F A World Cup twenty twenty six™ are based on data aggregated point-of-sale credit and debit card spending in C B S As (core based statistical areas) associated with tournament stadiums.
Additional information about the methodology used to aggregate the data is available upon request.
These materials have been prepared by Bank of America Institute and are provided to you for general information purposes only. To the extent these materials reference Bank of America data, such materials are not intended to be reflective or indicative of, and should not be relied upon as, the results of operations, financial conditions or performance of Bank of America. Bank of America Institute is a think tank dedicated to uncovering powerful insights that move business and society forward. Drawing on data and resources from across the bank and the world, the Institute delivers important, original perspectives on the economy, sustainability and global transformation. Unless otherwise specifically stated, any views or opinions expressed herein are solely those of Bank of America Institute and any individual authors listed, and are not the product of the B of A Global Research department or any other department of Bank of America Corporation or its affiliates and/or subsidiaries (collectively Bank of America). The views in these materials may differ from the views and opinions expressed by the B of A Global Research department or other departments or divisions of Bank of America. Information has been obtained from sources believed to be reliable, but Bank of America does not warrant its completeness or accuracy. These materials do not make any claim regarding the sustainability of any product or service. Any discussion of sustainability is limited as set out herein. Views and estimates constitute our judgment as of the date of these materials and are subject to change without notice. The views expressed herein should not be construed as individual investment advice for any particular person and are not intended as recommendations of particular securities, financial instruments, strategies or banking services for a particular person. This material does not constitute an offer or an invitation by or on behalf of Bank of America to any person to buy or sell any security or financial instrument or engage in any banking service. Nothing in these materials constitutes investment, legal, accounting or tax advice.
Copyright two thousand twenty six Bank of America Corporation. All rights reserved.


.jpg/_jcr_content/renditions/original)


